Prometheus client
前言
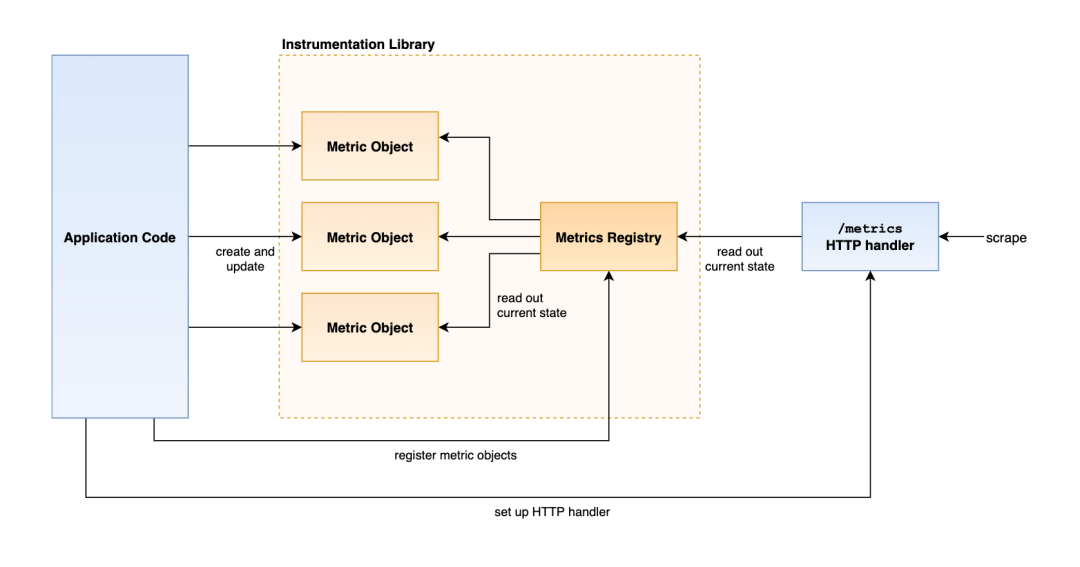
metric object
package metric
var studentCounterVec = prometheus.NewCounterVec(
		prometheus.CounterOpts{
			Name: "student",
			Help: "The number of student",
		},
		[]string{"class", "age"},
    )
func Start(){
    prometheus.MustRegister(studentCounterVec)
    http.Handle("/metrics", promhttp.Handler())
    go http.ListenAndServe(":8888", nil)
}
func Inc(class, age string) {
	studentCounterVec.With(prometheus.Labels{"class": number1, "age": 18}).Inc()
}
之后便可以在代码其它地方 使用metric.Inc 添加某个班级、年龄的学生人数了。
数据写入
一个指标由Metric name + Labels共同确定,若Metric name相同,但Label的值不同,则是不同的Metric。
CounterVec/GaugeVec/HistogramVec/SummaryVec 作为 Counter/Gauge/Histogram/Summary(均实现了Metric interface)的容器,都聚合了 metricVec,以 CounterVec为例,CounterVec.With(labels) ==> CounterVec.GetMetricWith(labels) ==> Metric = metricVec.getMetricWith(labels)
type CounterVec struct {
	*metricVec
}
// metricVec is a Collector to bundle metrics of the same name that differ in their label values. metricVec is not used directly (and therefore unexported). It is used as a building block for implementations of vectors of a given metric type, like GaugeVec, CounterVec, SummaryVec, and HistogramVec. It also handles label currying.
// github.com/prometheus/client_golang/prometheus/vec.go
type metricVec struct {
	*metricMap
	curry []curriedLabelValue
	// hashAdd and hashAddByte can be replaced for testing collision handling.
	hashAdd     func(h uint64, s string) uint64
	hashAddByte func(h uint64, b byte) uint64
}
func (v *CounterVec) GetMetricWith(labels Labels) (Counter, error) {
	metric, err := v.metricVec.getMetricWith(labels)
	if metric != nil {
		return metric.(Counter), err
	}
	return nil, err
}
type metricMap struct {
    mtx       sync.RWMutex // Protects metrics.
    // key=根据label值计算出的hash值
	metrics   map[uint64][]metricWithLabelValues
	desc      *Desc
	newMetric func(labelValues ...string) Metric
}
type Counter interface {
	Metric
	Collector
	Inc()
	Add(float64)
}
数据写入即由开发直接创建 CounterVec/GaugeVec/HistogramVec/SummaryVec ,根据labels 找到对应的metric( Counter/Gauge/Histogram/Summary) 进行数据操作。
数据读取
可以直接通过 http://ip:port/metrics 获取metric 数据
type Registry struct {
	mtx                   sync.RWMutex
	collectorsByID        map[uint64]Collector // ID is a hash of the descIDs.
	descIDs               map[uint64]struct{}
	...
}
开发直接创建的 CounterVec/GaugeVec/HistogramVec/SummaryVec 注入到Registry 中,Registry持有一个Collector 集合,同时Counter/Gauge/Histogram/Summary 均实现Collector 接口的 Collect 方法, metric 请求 ==> Registry.Gather() ==> 各种collector.Collect
// Prometheus拉取的入口
http.Handle("/metrics", promhttp.Handler())
// http.go promhttp.Handler()
func Handler() http.Handler {
	return InstrumentMetricHandler(
		prometheus.DefaultRegisterer, HandlerFor(prometheus.DefaultGatherer, HandlerOpts{}),
    )
}
// http.go HandlerFor
func HandlerFor(reg prometheus.Gatherer, opts HandlerOpts) http.Handler {
    ...
	mfs, err := reg.Gather() // 收集Metric信息
    ...
}
func (r *Registry) Gather() ([]*dto.MetricFamily, error) {
    ...
    // 声明Counter类型的Metric后,需要MustRegist注册到Registry,最终就是保存在collectorsByID里
    // Counter类型本身就是一个collector
	for _, collector := range r.collectorsByID {
		checkedCollectors <- collector
	}
	...
	collectWorker := func() {
		for {
			select {
			case collector := <-checkedCollectors:  //collector metric写入checkedMetricChan
				collector.Collect(checkedMetricChan) // 执行Counter的Collect,见下文
			case collector := <-uncheckedCollectors:
				collector.Collect(uncheckedMetricChan)
			default:
				return
			}
			wg.Done()
		}
    }
    // 消费 checkedMetricChan 将结果聚合到 []*dto.MetricFamily 中
    ...
}
func (m *metricMap) Collect(ch chan<- Metric) {
    ...
	for _, metrics := range m.metrics {
		for _, metric := range metrics {
			ch <- metric.metric
		}
	}
k8s使用实践
除了开发 手动创建XXVec 并在代码中使用,k8s client-go等一些库 会在代码中定义 XXProvider 接口
k8s.io/client-go
    /tools/leaderelection/metrics.go
    /util/workqueue/metrics.go
MetricsProvider 作为client-go 与业务开发的边界。
- client-go 并不负责创建 XXVec, XXVec的创建由使用者手动创建,并注册到prometheus registry中,对外通过prometheus server 暴露http api出去。对内通过MetricsProvider 暴露给 client-go workqueue
// k8s.io.component-base.metrics.prometheus.workqueue function init(){ workqueue.SetProvider(workqueueMetricsProvider{}) } -
client-go 通过MetricsProvider 获取到 metric 并赋值数据
 // k8s.io/client-go/util/workqueue/metrics.go
 type MetricsProvider interface {
     NewDepthMetric(name string) GaugeMetric
     NewAddsMetric(name string) CounterMetric
     NewLatencyMetric(name string) HistogramMetric
     NewWorkDurationMetric(name string) HistogramMetric
     NewUnfinishedWorkSecondsMetric(name string) SettableGaugeMetric
     NewLongestRunningProcessorSecondsMetric(name string) SettableGaugeMetric
     NewRetriesMetric(name string) CounterMetric
 }
 type CounterMetric interface {
     Inc()
 }
 // k8s.io/client-go/util/workqueue/queue.go
 func (q *Type) Add(item interface{}) {
     ...
     q.metrics.add(item)
     ...
 }
留下评论