k8s水平扩缩容
简介
新玩法:OpenKruise v0.10.0 新特性 WorkloadSpread 解读用户自己规划基础节点池和弹性节点池。应用部署时需要固定数量或比例的 Pod 部署在基础节点池,其余的都扩到弹性节点池。缩容时,优先从弹性节点缩容以节省成本。
Kubernetes Autoscaling in Production: Best Practices for Cluster Autoscaler, HPA and VPA 未读
Kubernetes 弹性伸缩全场景解析 (一)- 概念延伸与组件布局传统上弹性伸缩主要解决的问题是容量规划与实际负载的矛盾,现在是资源成本与可用性之间的博弈。 Kubernetes 弹性伸缩全场景解读(二) - HPA 的原理与演进 Kubernetes 弹性伸缩全场景解析(三) - HPA 实践手册 Kubernetes 弹性伸缩全场景解析 (四)- 让核心组件充满弹性 Kubernetes 弹性伸缩全场景解读(五) - 定时伸缩组件发布与开源
简介
Horizontal Pod AutoscalerThe Horizontal Pod Autoscaler automatically scales the number of Pods in a replication controller, deployment, replica set or stateful set based on observed CPU utilization (or, with custom metrics support, on some other application-provided metrics). Note that Horizontal Pod Autoscaling does not apply to objects that can’t be scaled, for example, DaemonSets.
The Horizontal Pod Autoscaler is implemented as a Kubernetes API resource and a controller. The resource determines the behavior of the controller. The controller periodically adjusts the number of replicas in a replication controller or deployment to match the observed average CPU utilization to the target specified by user. PS: 理想状态从一个确定的replicas 变成了 规则
- 面向的k8s object :deployment, replicaset or statefulset
- 扩缩容依据:CPU utilization 和 custom metrics
- 实现:定义了一个hpa resource ,以及对应的 controller; 与一般controller 略微不同的是 周期性执行(默认15s)
扩缩容策略
扩缩容的计算规则如下,注意不是一个一个加或减,需要设定的 desiredMetricValue 不是阈值,计算公式 从效果上确实是 “currentMetricValue 大于desiredMetricValue 就扩容,反之就缩容”。hpa针对 metirc 直接计算 desiredReplicas(可能一次扩两三个),之后desiredReplicas 与 minReplicas 和maxReplicas 比较得出 最终的replicas。
// ratio 在一定范围内会被忽略(即认为波动太小)
ratio = currentMetricValue / desiredMetricValue
desiredReplicas = ceil[currentReplicas * ratio]
运行 hpa controller 需要给kube-controller-manager服务增加三个参数:
--horizontal-pod-autoscaler-sync-period=30s \		# hpa 轮询间隔
--horizontal-pod-autoscaler-downscale-delay=3m0s \
--horizontal-pod-autoscaler-upscale-delay=3m0s
这些参数 在v2beta2 hpa 中由 Behavior 替代。Advanced HPA in Kubernetes
apiVersion: autoscaling/v2beta2
kind: HorizontalPodAutoscaler
metadata:
  name: example-deployment
spec:
  scaleTargetRef:
    apiVersion: apps/v1
    kind: Deployment
    name: example-deployment
  minReplicas: 1
  maxReplicas: 10
  behavior:
    scaleDown:
      selectPolicy: Disabled			# scaleDown 关闭
    scaleUp:
      stabilizationWindowSeconds: 120
      policies:
      - type: Percent
        value: 10						# 假设当前有 10个 pod,则 10 * 10% =1 ,即每次扩容batch 扩1个
        periodSeconds: 60
      - type: Pods						# 即每次扩容batch 扩4个
        value: 4
        periodSeconds: 60
      selectPolicy: Max					# 假设当前有 10个 pod,按上述两种策略的最大值,每次扩容batch 扩4个
  metrics:
  - type: Resource
    resource:
      name: cpu
      target:
        type: Utilization
        averageUtilization: 50
HPA 注意事项
- 如果设置了多个弹性伸缩指标,HPA 会依据各个指标,分别计算出目标副本数,取最大值进行扩缩容操作。
- 当指标类型选择为 CPU 利用率(占 Request)时,必须为容器设置 CPU Request。
- HPA 在计算目标副本数时会有一个 10% 的波动因子。如果在波动范围内,HPA 并不会调整副本数目。
- 如果服务对应的 Deployment.spec.replicas 值为 0,HPA 将不起作用。
- 如果对单个 Deployment 同时绑定多个 HPA ,则创建的 HPA 会同时生效,会造成工作负载的副本重复扩缩。
示例
hpa 的两个基本
- minReplicas/maxRepicas 定义扩缩容的上下限
- Target metrics/ targetValue threshold,选一个或多个指标,定一个阈值,来评估当前的负载,If the metric readings are above this value, and (currentReplicas < maxReplicas), HPA will scale up.
示例
apiVersion: autoscaling/v2beta2
kind: HorizontalPodAutoscaler
metadata:
  name: php-apache
  namespace: default
spec:
  scaleTargetRef:   # HPA的伸缩对象描述,HPA会动态修改该对象的pod数量
    apiVersion: apps/v1
    kind: Deployment
    name: php-apache
  # HPA的最小pod数量和最大pod数量
  minReplicas: 1
  maxReplicas: 10
  # 监控的指标数组,支持多种类型的指标共存
  metrics:
  - type: Resource
    resource:
      name: cpu
      target:
        type: Utilization
        averageUtilization: 50
target共有3种类型:Utilization、Value、AverageValue。Utilization表示平均使用率;Value表示裸值;AverageValue表示平均值。
获取metric 数据
默认 HPA 只支持基于 CPU 和内存的自动伸缩,例如当 CPU 使用率超过阈值时就自动增加应用实例数,当 CPU 使用率又低于阈值时就自动减少实例数。 但是默认 HPA 驱动弹性的维度比较单一,并不能满足日常的运维需求。可以将 HPA 和开源的 Keda 结合使用,Keda 可以从事件、定时、自定义指标等维度来驱动弹性。
| 指标来源 | api | metric | 已有实现 | |
|---|---|---|---|---|
| Resource | metrics.k8s.io | cpu/mem | metric-server | Pod 的资源指标,计算的时候要除以 Pod 数目再对比阈值进行判断 |
| pods | custom.metrics.k8s.io | Prometheus Adapter/ Microsoft Azure Adapter/Google Stackdriver | 每个 Pod 的自定义指标,计算时要除以 Pods 的数目 | |
| object | custom.metrics.k8s.io | Prometheus Adapter/ Microsoft Azure Adapter/Google Stackdriver | CRD 等对象的监控指标,直接计算指标比对阈值 | |
| external | external.metrics.k8s.io | 比如某个消息队列的长度 | refers to a global metric that is not associated with any Kubernetes object |
可以看到,除了 external外,metric 一般用来 describe 一个k8s object。可以做一个推断:除了external外,metric 在k8s的视角里, 一般作为k8s object 的附属而存在,这也体现在 使用k8s api 访问metric 的路径上 /apis/custom.metrics.k8s.io/namespaces/xx/k8sresources/xx/metricName
- client-go 是k8s 提供了 访问k8s 核心资源的api库, 对于metric 资源(比如PodMetrics/NodeMetrics),k8s 提供
k8s.io/metrics库 来简化访问。 HPAController 即 通过k8s.io/metrics库的MetricClient 获取metric 数据,MetricClient 会根据 hpa 中的resource 配置将其转换为 http url(对应上面3个域名)请求 来访问apiserver 获取metric - apiserver 可以将 http 请求转发给任何web 服务,除了内嵌的核心资源(及path)由apiserver 自身提供,To register an API, you add an APIService object, which “claims” the URL path in the Kubernetes API. At that point, the aggregation layer will proxy anything sent to that API path to the registered APIService. 具体的说
- apiserver 将
metrics.k8s.io的请求 转发到 metrics-server pod 上。PS: 因为kubectl top等要用 - apiserver 将
custom.metrics.k8s.io和external.metrics.k8s.io的请求 转到 查询APIService 配置 确定 的pod(或对应的Service或Ingress) 上。
- apiserver 将
- 汇总一下 hpa + MetricClient ==> apiserver ==> metric-server/prometheus-apadter ==> kubelet/prometheus
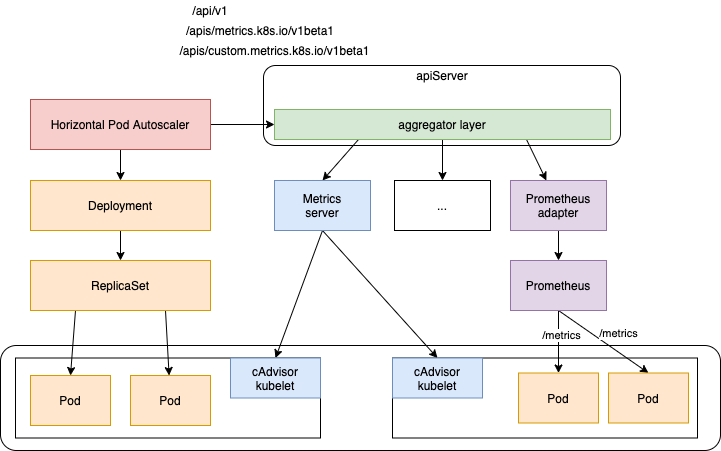
metric-server
查看nodes 指标 kubectl get --raw "/apis/metrics.k8s.io/v1beta1/nodes"
查看pods 指标 kubectl get --raw "/apis/metrics.k8s.io/v1beta1/pods"
APIService 将/apis/metrics.k8s.io/v1beta1 与 metrics-server(deployment/service) 关联在一起
apiVersion: apiregistration.k8s.io/v1
kind: APIService
metadata:
  annotations:
  name: v1beta1.metrics.k8s.io
spec:
  group: metrics.k8s.io
  insecureSkipTLSVerify: true
  service:
    name: metrics-server
    namespace: kube-system
    port: 443
  version: v1beta1
自定义metric 集成
Horizontally autoscale Kubernetes deployments on custom metrics未读
APIService 将/apis/custom.metrics.k8s.io/v1beta1 与 prometheus-adapter(deployment/service) 关联在一起
apiVersion: apiregistration.k8s.io/v1beta1
kind: APIService
metadata:
  name: v1beta1.custom.metrics.k8s.io
spec:
  service:
    name: custom-metrics-apiserver
    namespace: xx
  group: custom.metrics.k8s.io
  version: v1beta1
  insecureSkipTLSVerify: true
  groupPriorityMinimum: 100
  versionPriority: 100
prometheus-adapter 通过 configmap 的形式挂载配置文件,描述了 k8s metric 请求转为 prometheus rest 请求的过程,以 metric volcano_queue_allocatable_milli_gpu{instance="172.31.127.43:8080",job="kubernetes-service-endpoints",kubernetes_name="volcano-scheduler-service",kubernetes_namespace="xx",queue_name="default"} 为例
apiVersion: v1
kind: ConfigMap
metadata:
  name: adapter-config
  namespace: custom-metrics
data
  config.yaml: |
    rules:
    - seriesQuery: volcano_queue_allocatable_milli_gpu
      resources:
        overrides:
          kubernetes_namespace:         		# label
            resource: namespace					# label
          queue_name:
            group: scheduling.volcano.sh
            resource: queue
      metricsQuery: volcano_queue_allocatable_milli_gpu{<<.LabelMatchers>>}   # go template
- prometheus-adapter 会根据seriesQuery 查询metric
http://prometheusip:port/api/v1/series?match%5B%5D=volcano_queue_allocatable_milli_gpu&start=1637846254.136 - metricsQuery
volcano_queue_allocatable_milli_gpu{<<.LabelMatchers>>}会被转换为volcano_queue_allocatable_milli_gpu{kubernetes_namespace="xx",queue_name="xx"} - 当发出请求
kubectl get --raw "/apis/custom.metrics.k8s.io/v1beta1/namespaces/default/queues.scheduling.volcano.sh/default/volcano_queue_allocatable_milli_gpu",请求指定了 namespace=default, queues.scheduling.volcano.sh=default,prometheus-adapter 会向prometheus 发出请求http://prometheus.uat.ximalaya.com/api/v1/query?query=volcano_queue_allocatable_milli_gpu%7Bkubernetes_namespace%3D%22default%22%2Cqueue_name%3D%22default%22%7D&time=1637897470.763 - 可以查看
/apis/custom.metrics.k8s.io/v1beta1的资源kubectl get --raw "/apis/custom.metrics.k8s.io/v1beta1"
seriesQuery 和 metricsQuery 本例中看着很像,但实际上 在复杂场景下 配置不同,作用不同,这点要 根据 prometheus-adapter 才能确切判断。
对应hpa 配置
apiVersion: autoscaling/v2beta2
kind: HorizontalPodAutoscaler
metadata:
  name: nginx-deployment
  namespace: default
spec:
  scaleTargetRef:
    apiVersion: apps/v1
    kind: Deployment
    name: nginx-deployment
  minReplicas: 1
  maxReplicas: 10
  metrics:
  - type: Object
    object:
      metric:
	  	name: volcano_queue_allocatable_milli_gpu
	  target:
	    type: Value
	  	Value: 1000
      describedObject:
        apiVersion: scheduling.volcano.sh/v1beta1
        kind: Queue
        name: default
源码分析
启动与初始化
// k8s.io/kubernetes/cmd/kube-controller-manager/app/controllermanager.go
func NewControllerInitializers(loopMode ControllerLoopMode) map[string]InitFunc {
    controllers["horizontalpodautoscaling"] = startHPAController
    ...
}
// k8s.io/kubernetes/cmd/kube-controller-manager/app/autoscaling.go
func startHPAController(ctx ControllerContext) (http.Handler, bool, error) {
	...
	return startHPAControllerWithRESTClient(ctx)
}
func startHPAControllerWithRESTClient(ctx ControllerContext) (http.Handler, bool, error) {
	clientConfig := ctx.ClientBuilder.ConfigOrDie("horizontal-pod-autoscaler")
	hpaClient := ctx.ClientBuilder.ClientOrDie("horizontal-pod-autoscaler")
	metricsClient := metrics.NewRESTMetricsClient(
		resourceclient.NewForConfigOrDie(clientConfig),
		custom_metrics.NewForConfig(clientConfig, ctx.RESTMapper, apiVersionsGetter),
		external_metrics.NewForConfigOrDie(clientConfig),
	)
	return startHPAControllerWithMetricsClient(ctx, metricsClient)
}
func startHPAControllerWithMetricsClient(ctx ControllerContext, metricsClient metrics.MetricsClient) (http.Handler, bool, error) {
	hpaClient := ctx.ClientBuilder.ClientOrDie("horizontal-pod-autoscaler")
	hpaClientConfig := ctx.ClientBuilder.ConfigOrDie("horizontal-pod-autoscaler")
	scaleKindResolver := scale.NewDiscoveryScaleKindResolver(hpaClient.Discovery())
	scaleClient, err := scale.NewForConfig(hpaClientConfig, ctx.RESTMapper, dynamic.LegacyAPIPathResolverFunc, scaleKindResolver)
	go podautoscaler.NewHorizontalController(
		hpaClient.CoreV1(),
		scaleClient,
		hpaClient.AutoscalingV1(),
		ctx.RESTMapper,
		metricsClient,
		ctx.InformerFactory.Autoscaling().V1().HorizontalPodAutoscalers(),
        ctx.InformerFactory.Core().V1().Pods(),
        // 扩缩容计算周期,默认15s
        ctx.ComponentConfig.HPAController.HorizontalPodAutoscalerSyncPeriod.Duration,
        // 两次缩容之间的间隔,防止抖动 默认5m
        ctx.ComponentConfig.HPAController.HorizontalPodAutoscalerDownscaleStabilizationWindow.Duration,
        // 如果 ratio 比较接近1,则忽略扩缩容,描述ratio 与1 接近的程度,默认0.1
        ctx.ComponentConfig.HPAController.HorizontalPodAutoscalerTolerance,
        // 用于设置 Pod 的初始化时间, 在此时间内的 Pod,CPU 资源度量值将不会被采纳。默认5m
        ctx.ComponentConfig.HPAController.HorizontalPodAutoscalerCPUInitializationPeriod.Duration,
        // 设置pod 的准备时间,在此时间内的 Pod 统统被认为未就绪,默认30s
		ctx.ComponentConfig.HPAController.HorizontalPodAutoscalerInitialReadinessDelay.Duration,
	).Run(ctx.Stop)
	return nil, true, nil
}
// k8s.io/kubernetes/pkg/controller/podautoscaler/horizontal.go
func NewHorizontalController(
	evtNamespacer v1core.EventsGetter,
	scaleNamespacer scaleclient.ScalesGetter,...
) *HorizontalController {
    hpaController := &HorizontalController{...}
    hpaInformer.Informer().AddEventHandlerWithResyncPeriod(
        // 将hpa resource 加入到 queue 中
		cache.ResourceEventHandlerFuncs{
			AddFunc:    hpaController.enqueueHPA,
			UpdateFunc: hpaController.updateHPA,
			DeleteFunc: hpaController.deleteHPA,
		},
		resyncPeriod,
    )
    hpaController.hpaLister = hpaInformer.Lister()
    hpaController.podLister = podInformer.Lister()
    replicaCalc := NewReplicaCalculator(...)
	hpaController.replicaCalc = replicaCalc
}
从HorizontalController到ReplicaCalculator
// k8s.io/kubernetes/pkg/controller/podautoscaler/horizontal.go
func (a *HorizontalController) Run(stopCh <-chan struct{}) {
	defer utilruntime.HandleCrash()
	defer a.queue.ShutDown()
	if !cache.WaitForNamedCacheSync("HPA", stopCh, a.hpaListerSynced, a.podListerSynced) {
		return
	}
	// start a single worker (we may wish to start more in the future)
	go wait.Until(a.worker, time.Second, stopCh)
	<-stopCh
}
func (a *HorizontalController) worker() {
	for a.processNextWorkItem() {
	}
}
func (a *HorizontalController) processNextWorkItem() bool {
    ...
	deleted, err := a.reconcileKey(key.(string))
	...
}
func (a *HorizontalController) reconcileKey(key string) (deleted bool, err error) {
	namespace, name, err := cache.SplitMetaNamespaceKey(key)
	hpa, err := a.hpaLister.HorizontalPodAutoscalers(namespace).Get(name)
	return false, a.reconcileAutoscaler(hpa, key)
}
func (a *HorizontalController) reconcileAutoscaler(hpav1Shared *autoscalingv1.HorizontalPodAutoscaler, key string) error {
	// hpa 对象
	hpa := hpaRaw.(*autoscalingv2.HorizontalPodAutoscaler)
	// 待扩缩容的对象
	scale, targetGR, err := a.scaleForResourceMappings(hpa.Namespace, hpa.Spec.ScaleTargetRef.Name, mappings)
	currentReplicas := scale.Spec.Replicas
	// 计算 desiredReplicas
	desiredReplicas := int32(0)
	minReplicas = *hpa.Spec.MinReplicas
	rescale := true
	if scale.Spec.Replicas == 0 && minReplicas != 0 {
		// Autoscaling is disabled for this resource
	} else if currentReplicas > hpa.Spec.MaxReplicas {
		rescaleReason = "Current number of replicas above Spec.MaxReplicas"
		desiredReplicas = hpa.Spec.MaxReplicas
	} else if currentReplicas < minReplicas {
		rescaleReason = "Current number of replicas below Spec.MinReplicas"
		desiredReplicas = minReplicas
	} else {
		metricDesiredReplicas, metricName, metricStatuses, metricTimestamp, err = a.computeReplicasForMetrics(hpa, scale, hpa.Spec.Metrics)
		rescaleMetric := ""
		if metricDesiredReplicas > desiredReplicas {
			desiredReplicas = metricDesiredReplicas
			rescaleMetric = metricName
		}
		if desiredReplicas > currentReplicas { rescaleReason = fmt.Sprintf("%s above target", rescaleMetric) }
		if desiredReplicas < currentReplicas { rescaleReason = "All metrics below target" }
		if hpa.Spec.Behavior == nil {
			desiredReplicas = a.normalizeDesiredReplicas(hpa, key, currentReplicas, desiredReplicas, minReplicas)
		} else {
			desiredReplicas = a.normalizeDesiredReplicasWithBehaviors(hpa, key, currentReplicas, desiredReplicas, minReplicas)
		}
		rescale = desiredReplicas != currentReplicas
	}
	// 如果需要扩缩容
	if rescale {
		scale.Spec.Replicas = desiredReplicas
		_, err = a.scaleNamespacer.Scales(hpa.Namespace).Update(context.TODO(), targetGR, scale, metav1.UpdateOptions{})
	} else { desiredReplicas = currentReplicas }
	return a.updateStatusIfNeeded(hpaStatusOriginal, hpa)
}
上述代码 描述了宏观逻辑:从queue 中取出 hpa resource,计算是否 rescale 以及 desiredReplicas,并实施。
// k8s.io/kubernetes/pkg/controller/podautoscaler/horizontal.go
// computeReplicasForMetrics computes the desired number of replicas for the metric specifications listed in the HPA,
// returning the maximum  of the computed replica counts, a description of the associated metric, and the statuses of
// all metrics computed.
func (a *HorizontalController) computeReplicasForMetrics(hpa *autoscalingv2.HorizontalPodAutoscaler, scale *autoscalingv1.Scale,metricSpecs []autoscalingv2.MetricSpec) (replicas int32, metric string, ...) {
	selector, err := labels.Parse(scale.Status.Selector)
	specReplicas := scale.Spec.Replicas
	statusReplicas := scale.Status.Replicas
	statuses = make([]autoscalingv2.MetricStatus, len(metricSpecs))
	invalidMetricsCount := 0
	for i, metricSpec := range metricSpecs {
        replicaCountProposal, metricNameProposal, timestampProposal, condition, err := a.computeReplicasForMetric(hpa, metricSpec, specReplicas, statusReplicas, selector, &statuses[i])
        // 每个metric 计算一个 需要扩缩容的数量,去最大值 作为最终的扩缩容的replicas
        if err == nil && (replicas == 0 || replicaCountProposal > replicas) {
			timestamp = timestampProposal
			replicas = replicaCountProposal
			metric = metricNameProposal
		}
	}
	// If all metrics are invalid return error and set condition on hpa based on first invalid metric.
	if invalidMetricsCount >= len(metricSpecs) {
		return 0, "", statuses, ...)
	}
	return replicas, metric, statuses, timestamp, nil
}
// Computes the desired number of replicas for a specific hpa and metric specification,
// returning the metric status and a proposed condition to be set on the HPA object.
func (a *HorizontalController) computeReplicasForMetric(hpa *autoscalingv2.HorizontalPodAutoscaler, spec autoscalingv2.MetricSpec,specReplicas, statusReplicas int32, selector labels.Selector, ...) (replicaCountProposal int32, metricNameProposal string,...) {
	switch spec.Type {
	case autoscalingv2.ObjectMetricSourceType:
		metricSelector, err := metav1.LabelSelectorAsSelector(spec.Object.Metric.Selector)
		replicaCountProposal, timestampProposal, metricNameProposal, condition, err = a.computeStatusForObjectMetric(specReplicas, statusReplicas, spec, hpa, selector, status, metricSelector)
	case autoscalingv2.PodsMetricSourceType:
		metricSelector, err := metav1.LabelSelectorAsSelector(spec.Pods.Metric.Selector)
		replicaCountProposal, timestampProposal, metricNameProposal, condition, err = a.computeStatusForPodsMetric(specReplicas, spec, hpa, selector, status, metricSelector)
	case autoscalingv2.ResourceMetricSourceType:
		replicaCountProposal, timestampProposal, metricNameProposal, condition, err = a.computeStatusForResourceMetric(specReplicas, spec, hpa, selector, status)
	case autoscalingv2.ExternalMetricSourceType:
		replicaCountProposal, timestampProposal, metricNameProposal, condition, err = a.computeStatusForExternalMetric(specReplicas, statusReplicas, spec, hpa, selector, status)
	default:
        ...
		return 0, "", time.Time{}, condition, err
	}
	return replicaCountProposal, metricNameProposal, ...
}
// computeStatusForPodsMetric computes the desired number of replicas for the specified metric of type PodsMetricSourceType.
func (a *HorizontalController) computeStatusForPodsMetric(currentReplicas int32, metricSpec autoscalingv2.MetricSpec, hpa *autoscalingv2.HorizontalPodAutoscaler, selector labels.Selector, status *autoscalingv2.MetricStatus, metricSelector labels.Selector) (replicaCountProposal int32, ...) {
	replicaCountProposal, utilizationProposal, timestampProposal, err := a.replicaCalc.GetMetricReplicas(currentReplicas, metricSpec.Pods.Target.AverageValue.MilliValue(), metricSpec.Pods.Metric.Name, hpa.Namespace, selector, metricSelector)
	*status = autoscalingv2.MetricStatus{...}
	return replicaCountProposal, timestampProposal, fmt.Sprintf("pods metric %s", metricSpec.Pods.Metric.Name), autoscalingv2.HorizontalPodAutoscalerCondition{}, nil
}
上述代码负责将计算逻辑转移到 ReplicaCalculator 进行
计算规则
// k8s.io/kubernetes/pkg/controller/podautoscaler/replica_calculator.go
func (c *ReplicaCalculator) GetMetricReplicas(currentReplicas int32, targetUtilization int64, metricName string, namespace string, selector labels.Selector, metricSelector labels.Selector) (replicaCount int32, utilization int64, ...) {
	metrics, timestamp, err := c.metricsClient.GetRawMetric(metricName, namespace, selector, metricSelector)
	replicaCount, utilization, err = c.calcPlainMetricReplicas(metrics, currentReplicas, targetUtilization, namespace, selector, v1.ResourceName(""))
	return replicaCount, utilization, timestamp, err
}
// calcPlainMetricReplicas calculates the desired replicas for plain (i.e. non-utilization percentage) metrics.
func (c *ReplicaCalculator) calcPlainMetricReplicas(metrics metricsclient.PodMetricsInfo, currentReplicas int32, targetUtilization int64, namespace string, selector labels.Selector, resource v1.ResourceName) (replicaCount int32, utilization int64, err error) {
	podList, err := c.podLister.Pods(namespace).List(selector)
	if len(podList) == 0 {
		return 0, 0, fmt.Errorf("no pods returned by selector while calculating replica count")
    }
    // PodPending/Unready/HorizontalPodAutoscalerCPUInitializationPeriod/HorizontalPodAutoscalerInitialReadinessDelay 的pod 加入到ignoredPods(即这些pod的metric 即便有也不能采信),找不到metric 数据的pod 加入到 missingPods,没有上述问题的pod 由 readyPodCount 计数
    readyPodCount, ignoredPods, missingPods := groupPods(podList, metrics, resource, c.cpuInitializationPeriod, c.delayOfInitialReadinessStatus)
    // ignoredPods 不参与 第一轮使用率计算
	removeMetricsForPods(metrics, ignoredPods)
	if len(metrics) == 0 {
		return 0, 0, fmt.Errorf("did not receive metrics for any ready pods")
    }
    // 先根据 包含可以采信的metric 数据的pod 计算一次使用率
	usageRatio, utilization := metricsclient.GetMetricUtilizationRatio(metrics, targetUtilization)
    rebalanceIgnored := len(ignoredPods) > 0 && usageRatio > 1.0    // 扩容 且有pod 的metric 数据无法采信
    /*
         等同于
         if  len(missingPods) == 0 {  // 所有的pod 都有metric 数据
            // 如果 所有的pod metric 都可以采信  或者 处于缩容状态
            if len(ignoredPods) <= 0 ||  usageRatio <= 1.0{}
         }
    */
	if !rebalanceIgnored && len(missingPods) == 0 {
		if math.Abs(1.0-usageRatio) <= c.tolerance {
			// return the current replicas if the change would be too small
			return currentReplicas, utilization, nil
		}
		// if we don't have any unready or missing pods, we can calculate the new replica count now
		return int32(math.Ceil(usageRatio * float64(readyPodCount))), utilization, nil
	}
    // 补全 missingPods 数据
	if len(missingPods) > 0 {
		if usageRatio < 1.0 {   // 使用率小于1 缩容场景
			// on a scale-down, treat missing pods as using 100% of the resource request
			for podName := range missingPods {
				metrics[podName] = metricsclient.PodMetric{Value: targetUtilization}
			}
		} else {    // 使用率大于 1 扩容场景
			// on a scale-up, treat missing pods as using 0% of the resource request
			for podName := range missingPods {
				metrics[podName] = metricsclient.PodMetric{Value: 0}
			}
		}
    }
    // 等同于 if len(ignoredPods) > 0 && usageRatio > 1.0
	if rebalanceIgnored { // 扩容 且有pod 无法参与判断, 补全ignoredPods 数据
		// on a scale-up, treat unready pods as using 0% of the resource request
		for podName := range ignoredPods {
			metrics[podName] = metricsclient.PodMetric{Value: 0}
		}
	}
	// re-run the utilization calculation with our new numbers
    newUsageRatio, _ := metricsclient.GetMetricUtilizationRatio(metrics, targetUtilization)
    // 在 tolerance 范围内,usageRatio  和 newUsageRatio 扩缩容偏好 矛盾,则放弃扩缩容
	if math.Abs(1.0-newUsageRatio) <= c.tolerance || (usageRatio < 1.0 && newUsageRatio > 1.0) || (usageRatio > 1.0 && newUsageRatio < 1.0) {
		// return the current replicas if the change would be too small,
		// or if the new usage ratio would cause a change in scale direction
		return currentReplicas, utilization, nil
	}
	// return the result, where the number of replicas considered is
	// however many replicas factored into our calculation
	return int32(math.Ceil(newUsageRatio * float64(len(metrics)))), utilization, nil
}
整体思路
- 将 pod 分组为 ignoredPods(pod metric 不能采信)/missingPods(pod 没有metric)/readyPods(有可信metric 的pod)
- 先根据 包含可以采信的metric 数据的pod(readyPods) 计算一次使用率
- 如果pod metric 都可以采信,或基于已有的 可采信metric 数据已经确定缩容了,则直接 按公式计算 扩缩容 replicas即可。否则根据 扩缩容场景 来补全 ignoredPods/missingPods 的metric 数据
- 根据扩缩容场景 补全missingPods 的metric 数据,扩容场景下 补全ignoredPods metric 数据
- 此时所有的pod 都有了 真实的或补全的metric 数据,重新计算一次 使用率
- 如果两次计算的使用率 扩缩容偏好 不矛盾 且 扩缩容Ratio 超过 tolerance ,则计算 扩缩容的replicas 并返回
计算的原料——metric
kubectl get --raw /apis/metrics.k8s.io/v1beta1/nodes/<node-name> 可以拿到一个示例的node metric数据
{
    "kind": "NodeMetrics",
    "apiVersion": "metrics.k8s.io/v1beta1",
    "metadata": {
        "name": "192.168.xx.xx",
        "selfLink": "/apis/metrics.k8s.io/v1beta1/nodes/192.168.60.96",
        "creationTimestamp": "2020-10-13T06:39:03Z"
    },
    "timestamp": "2020-10-13T06:37:46Z",
    "window": "30s",
    "usage": {
        "cpu": "1792787098n",
        "memory": "48306672Ki"
    }
}
// k8s.io/kubernetes/pkg/controller/podautoscaler/metrics/interfaces.go
type PodMetric struct {
	Timestamp time.Time
	Window    time.Duration
	Value     int64
}
type PodMetricsInfo map[string]PodMetric
type MetricsClient interface {
    // allows consumers to access resource metrics (CPU and memory) for pods and nodes.
	GetResourceMetric(resource v1.ResourceName, namespace string, selector labels.Selector) (PodMetricsInfo, time.Time, error)
	GetRawMetric(metricName string, namespace string, selector labels.Selector, metricSelector labels.Selector) (PodMetricsInfo, time.Time, error)
	GetObjectMetric(metricName string, namespace string, objectRef *autoscaling.CrossVersionObjectReference, metricSelector labels.Selector) (int64, time.Time, error)
	GetExternalMetric(metricName string, namespace string, selector labels.Selector) ([]int64, time.Time, error)
}
// k8s.io/kubernetes/pkg/controller/podautoscaler/metrics/rest_metrics_client.go
type restMetricsClient struct {
	*resourceMetricsClient
	*customMetricsClient
	*externalMetricsClient
}
func (c *resourceMetricsClient) GetResourceMetric(resource v1.ResourceName, namespace string, selector labels.Selector) (PodMetricsInfo, time.Time, error) {
	metrics, err := c.client.PodMetricses(namespace).List(context.TODO(), metav1.ListOptions{LabelSelector: selector.String()})
	res := make(PodMetricsInfo, len(metrics.Items))
	for _, m := range metrics.Items {
		podSum := int64(0)
		missing := len(m.Containers) == 0
		for _, c := range m.Containers {
			resValue, found := c.Usage[v1.ResourceName(resource)]
			if !found {
				missing = true
				klog.V(2).Infof("missing resource metric %v for container %s in pod %s/%s", resource, c.Name, namespace, m.Name)
				break // containers loop
			}
			podSum += resValue.MilliValue()
		}
		if !missing {
			res[m.Name] = PodMetric{
				Timestamp: m.Timestamp.Time,
				Window:    m.Window.Duration,
				Value:     int64(podSum),
			}
		}
	}
	timestamp := metrics.Items[0].Timestamp.Time
	return res, timestamp, nil
}
解决响应速度问题
官方的这个HPA Controller在实现的时候用的是一个Gorountine来处理整个集群的所有HPA的计算和同步问题,在集群配置的HPA比较多的时候可能会导致业务扩容不及时的问题,其次官方HPA Controller不支持为每个HPA进行单独的个性化配置。为了优化HPA Controller的性能和个性化配置问题,我们把HPA Controller单独抽离出来单独部署。同时为每一个HPA单独配置一个Gorountine,并且每一个HPA多可以根据业务的需要进行单独的配置。
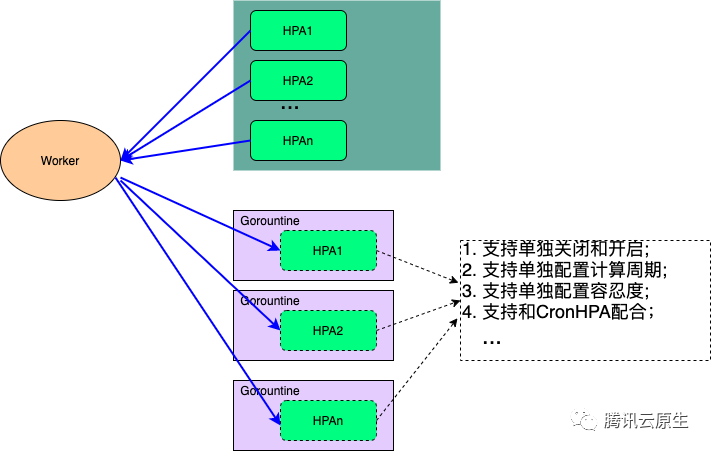
其实仅仅优化HPA Controller还是不能满足一些业务在业务高峰时候的一些需求,比如在业务做活动的时候,希望在流量高峰期之前就能够把业务扩容好。这个时候我们就需要一个定时HPA的功能,为此我们定义了一个CronHPA的CRD和CronHPA Operator。CronHPA会在业务定义的时间进行扩容和缩容,同时还能和HPA一起配合工作。
扩缩容策略优化
AMS 新闻视频广告的云原生容器化之路选取衡量指标的核心思想:是尽量选取变化最大的指标,避免变化较小的指标限制 Pod 数量的变化,导致其他负载指标的变化超出资源限制。对于离线任务而言,一般来说,CPU 使用率更容易随着任务的开启和结束发生变化,而内存一般存储相对固定的上下文,比较稳定,选取 CPU 使用率作为判定标准比较合理。
我们需要根据具体的负载变化曲线,决定弹性缩扩容的策略。
- 如果负载曲线在每一天每一个时段下都高度一致,我们可以考虑使用 CronHPA 组件,人工指定不同时段的 Pod 数量,定期调度。
- 如果负载曲线每天都在发生变化,不论趋势还是数值,我们都可以使用 HPA 配置,设置 CPU 使用率参考值,要求集群在利用率超过或低于指定值时进行 Pod 数量的调整,将 Pod 的 CPU 使用率维持在容忍范围内。
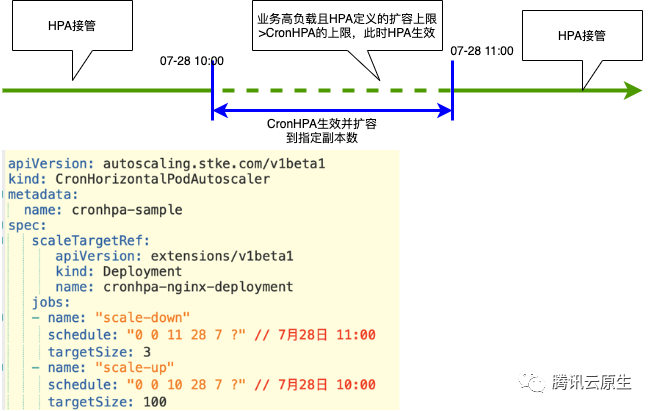
- 如果负载曲线每天发生变化,但是存在定时发生的尖峰,为了避免集群自行调整的速度慢于负载增长的速度,导致集群被压垮,我们可以结合 CronHPA 与 HPA 使用,平时将控制权交给 HPA,在尖峰到来前使用 CronHPA 提前扩容,既保证尖峰不会冲垮集群,又能享受集群自动调整 Pod 数量带来的便利。
AHPA:开启 Kubernetes 弹性预测之门一般在 Kubernetes 中管理应用实例数有三种方式:固定实例数、HPA 和 CronHPA 。使用最多的是固定实例数,固定实例数最大的问题就是在业务波谷时造成很明显的资源浪费。为了解决资源浪费的问题所以有了 HPA,但 HPA 的弹性触发是滞后的、被动的,这就导致资源的供给也会滞后,资源不能及时供给可能会导致业务稳定性下降。CronHPA 可以定时伸缩,看起来可以解决弹性滞后的问题,但具体定时粒度有多细、业务量有变化时需要频繁地手动调节定时弹性策略吗?AHPA有两个弹性策略:主动预测和被动预测。主动预测基于 RobustSTL 算法从历史数据中识别周期性趋势,主动预测下个周期应用的实例数量;被动预测基于应用实时数据设定实例数量,可以很好的应对突发流量。此外,AHPA 还增加了兜底保护策略,用户可以设置实例数量的上下界。AHPA 算法中最终生效的实例数是主动预测、被动预测及兜底策略中的最大值。PS:目的是缩短扩容时间。 甩掉容量规划炸弹:用 AHPA 实现 Kubernetes 智能弹性伸缩 预测器的实现本身就是一个很有意思的设计。
EPA——腾讯推出国内首个云原生成本优化开源项目 Crane传统基于事件的弹性工具会导致一个天然缺陷——当业务指标偏离正常值后才会触发弹性,这种滞后性使得云用户不敢使用弹性。EPA 支持可扩展的预测算法,以预测结果驱动横向和纵向弹性,确保业务能提前弹出来,彻底避免原生弹性能力未弹先死的尴尬。同时 Crane 将社区的 HPA 和 VPA 两种弹性能力统一起来,提出了弹性概念 EPA。
原生HPA在支持多方数据指标时,需要做大量的工作来适配,并且原生HPA不支持预定的伸缩(解决弹性滞后的问题)、缩容到0(解决测试环境资源浪费问题)等问题,所以就出现各种基于HPA的扩展。EDA是用于 Kubernetes 的基于事件驱动弹性伸缩器,用户只需要创建 ScaledObject 或 ScaledJob 来定义你想要伸缩的对象和你想要使用的触发器,KEDA 会处理剩下的一切!
蚂蚁集团云原生智能容量技术 KapacityStack 正式开源HPA在实际大规模生产使用上的效果和实用度上却并不理想,主要由以下几个原因导致:
- HPA 的自动扩缩容通过响应式的方式驱动,仅当应用负载已经超出设定水位时才会触发扩容,此时容量风险已经出现,只能起到应急的作用而非提前规避风险,尤其对于自身启动时间较长的应用,几乎起不到快速应对流量洪峰的作用。
- HPA 通过简单的指标折比来计算扩缩容目标副本数,只适用于应用副本数和相关指标呈严格线性相关的理想场景,但实际生产当中应用的各类指标和副本数之间存在错综复杂的关系,该算法很难得到符合容量水位要求的副本数。
- 容量弹性作为变更故障率较高的一类场景,HPA 除了支持限制扩缩容速率外没有提供任何其他的风险防控手段,在稳定性要求较高的生产环境中大规模落地是很难令人放心的。
- HPA 作为 Kubernetes 内置能力,一方面自然有其开箱即用的好处,但另一方面也使其绑定在了具体的 K8s 版本上,自身的行为难以被用户扩展或调整,难以满足各类用户在不同应用场景下的定制化需求。 Kapacity 的第一个开源核心能力—— IHPA(全称 Intelligent Horizontal Pod Autoscaler)就是为了解决上述所有问题应运而生的。
技术决策案例
欢乐游戏 Istio 云原生服务网格三年实践思考对于 hpa 笔者早先的态度还是有些犹豫的,因为这本质上是会将服务部署发布时机变得不可控,不像是常规人工干预的发布,出了问题好介入。线上也确实出过一些问题,例如 hpa (会依赖 hpa 关联的 metric 链路畅通)夜间失效导致业务过载;还有就是在日志采集弄好之前,hpa 导致 pod 漂移,前一天夜里某 pod 的告警信息,第二天想看就比较费劲,还得跑到之前调度到的 node 上去看;另外也出现过进程 hpa 启动不起来的问题,配置有误无法加载初始化成功,正在跑着的进程只会 reload 失败,但是停掉重启就会启动失败。不过 hpa 对于提升资源利用率,还是很有价值的,所以我们现在的做法是做区分对待,对于普通的业务,min 副本数可以较小,对于重要的服务,min 副本数则配置稍大一些。PS:我的感觉是,一部分实例交给原来的deployment管,一部分实例交给hpa 管,打上不同的标签,是一个比较安全的方案。
留下评论